
Stock Sentiment Analysis
Ever heard of a bear market
🐻 ?
Project Details
In March 2020, the stock market had a collapse that sent us packing to 1929. I wanted to do a sentiment analysis around that time using twitter data that I was able to gather. Sentiment analysis is one of the leading advancements in unconstructed data analysis. The ability to use machine learning on sentiment is a key cog in the world of NLP or natural language processing. Today, NLP is used in a lot of different sectors to understand consumer behavior in order to leverage behavior more effectively for revenue gains.
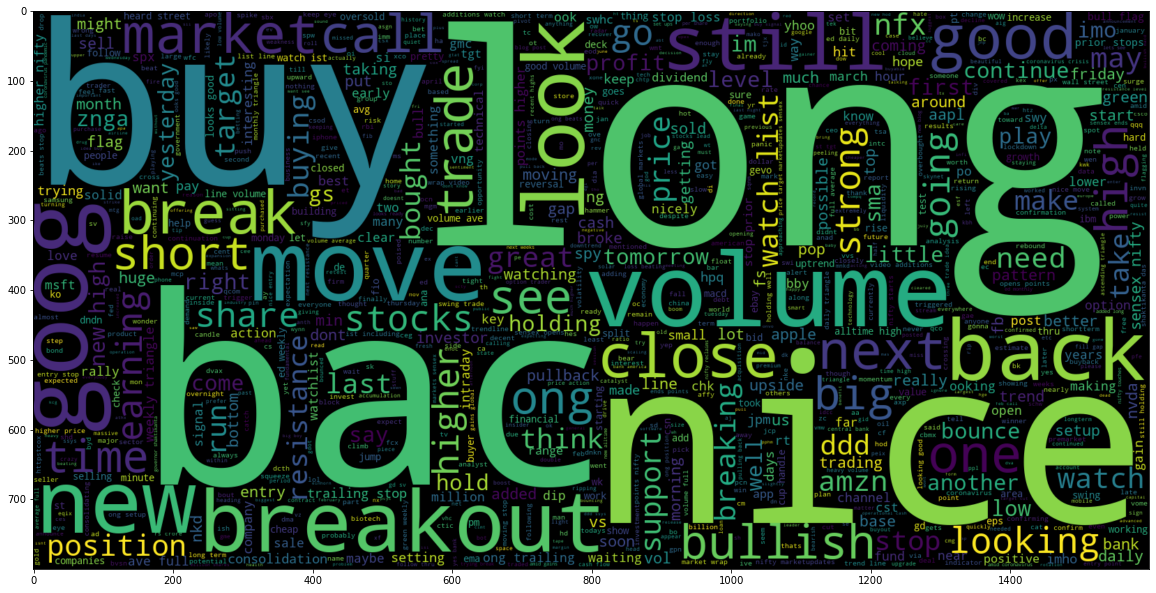
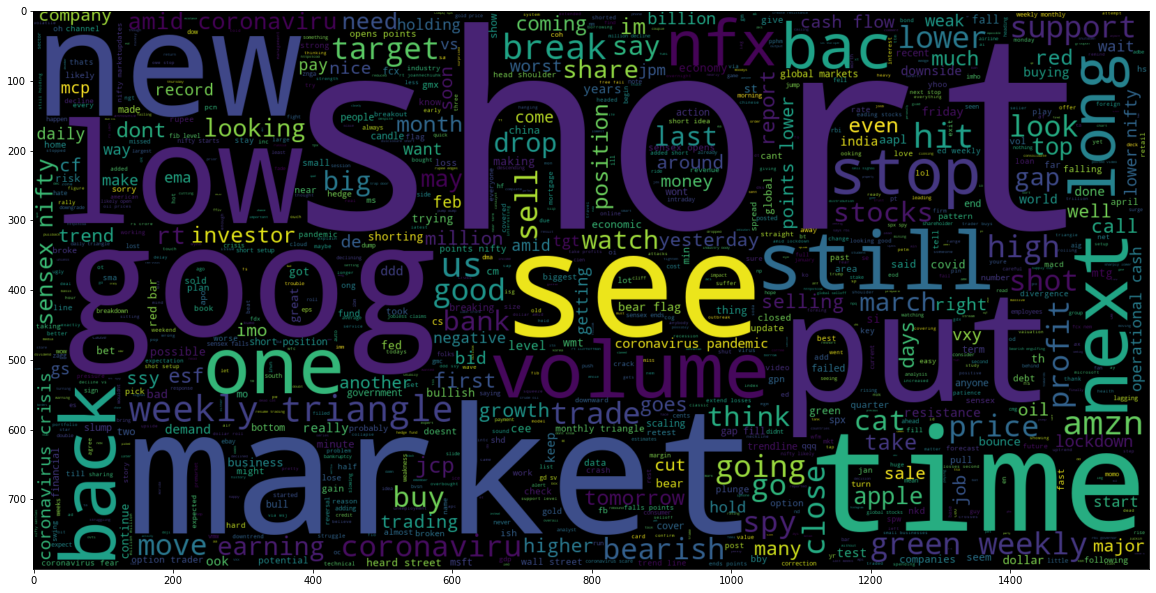
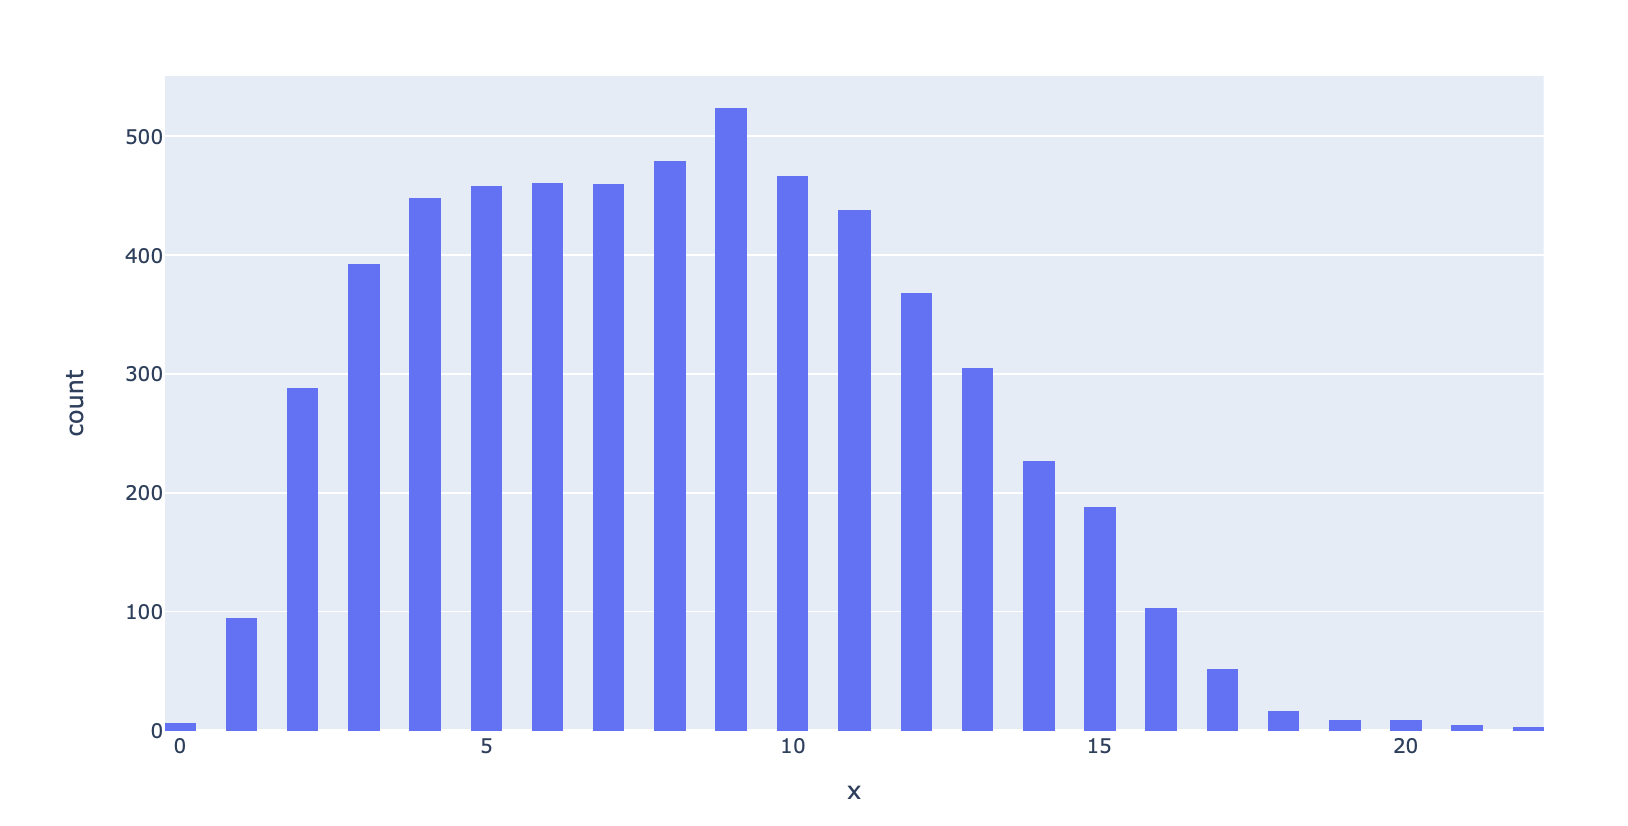
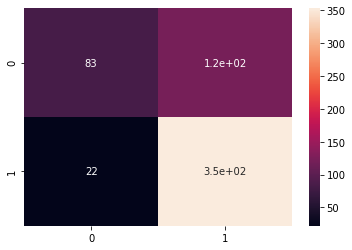
In the script, you will be able to see the most influential words from the twitter data in the word clouds visual. You will also see how people tweet in the finance world as the average words per tweet is roughly 8 or 9. At the end of the script, I will show a model that is able to show predicition capabilities at 78% and give a visual following to lend insights into the results.
Please share on linkedin with the button above and take a look at the code yourself if you want to get into data science or finance! 🔗
I’m looking for new projects to take on so if you have suggestions please let me know and send a message through your preferred medium!
📥
IMPORT DATASETS AND LIBRARIES
# Data Manipulation
import pandas as pd
import numpy as np
import matplotlib.pyplot as plt

# Data Visualization
import seaborn as sns
from wordcloud import WordCloud, STOPWORDS
import plotly.express as px
from sklearn.metrics import confusion_matrix

# NLP
import nltk
import re
from nltk.stem import PorterStemmer, WordNetLemmatizer
from nltk.corpus import stopwords
from nltk.tokenize import word_tokenize, sent_tokenize
import gensim
from gensim.utils import simple_preprocess
from gensim.parsing.preprocessing import STOPWORDS


# Tensorflow
import tensorflow as tf
from tensorflow.keras.preprocessing.text import one_hot, Tokenizer
from tensorflow.keras.preprocessing.sequence import pad_sequences
from tensorflow.keras.models import Sequential
from tensorflow.keras.layers import Dense, Flatten, Embedding, Input, LSTM, Conv1D, MaxPool1D, Bidirectional, Dropout
from tensorflow.keras.models import Model
from tensorflow.keras.utils import to_categorical

# Transformer
from transformers import pipeline
# load the stock news data
stocks_df = pd.read_csv("/Users/andrewdarmond/Documents/FinanceML/stock_sentiment.csv")
# Let's view the dataset
stocks_df.head()
| Text | Sentiment | |
|---|---|---|
| 0 | Kickers on my watchlist XIDE TIT SOQ PNK CPW B... | 1 |
| 1 | user: AAP MOVIE. 55% return for the FEA/GEED i... | 1 |
| 2 | user I'd be afraid to short AMZN - they are lo... | 1 |
| 3 | MNTA Over 12.00 | 1 |
| 4 | OI Over 21.37 | 1 |
# dataframe information
stocks_df.info()
<class 'pandas.core.frame.DataFrame'>
RangeIndex: 5791 entries, 0 to 5790
Data columns (total 2 columns):
 #   Column     Non-Null Count  Dtype
---  ------     --------------  -----
 0   Text       5791 non-null   object
 1   Sentiment  5791 non-null   int64
dtypes: int64(1), object(1)
memory usage: 90.6+ KB
# check for null values
stocks_df.isnull().sum()
Text         0
Sentiment    0
dtype: int64
# check for unique values
stocks_df['Sentiment'].nunique()
2
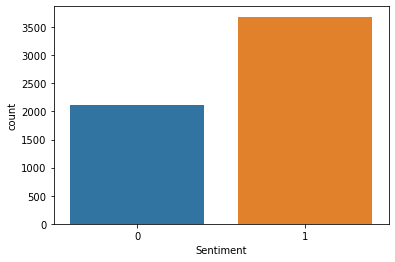
ax = sns.countplot(x="Sentiment", data=stocks_df);
print('''"0" = Negative & "1" = Positive''')
"0" = Negative & "1" = Positive
PERFORM DATA CLEANING (REMOVE PUNCTUATIONS FROM TEXT)
import string
string.punctuation
'!"#$%&\'()*+,-./:;<=>?@[\\]^_`{|}~'
# Let's define a function to remove punctuations
def remove_punc(message):
  Test_punc_removed = [char for char in message if char not in string.punctuation]
  Test_punc_removed_join = ''.join(Test_punc_removed)
  return Test_punc_removed_join
# Let's remove punctuations from our dataset
stocks_df['Text Without Punctuation'] = stocks_df['Text'].apply(remove_punc)
stocks_df
| Text | Sentiment | Text Without Punctuation | |
|---|---|---|---|
| 0 | Kickers on my watchlist XIDE TIT SOQ PNK CPW B... | 1 | Kickers on my watchlist XIDE TIT SOQ PNK CPW B... |
| 1 | user: AAP MOVIE. 55% return for the FEA/GEED i... | 1 | user AAP MOVIE 55 return for the FEAGEED indic... |
| 2 | user I'd be afraid to short AMZN - they are lo... | 1 | user Id be afraid to short AMZN they are look... |
| 3 | MNTA Over 12.00 | 1 | MNTA Over 1200 |
| 4 | OI Over 21.37 | 1 | OI Over 2137 |
| ... | ... | ... | ... |
| 5786 | Industry body CII said #discoms are likely to ... | 0 | Industry body CII said discoms are likely to s... |
| 5787 | #Gold prices slip below Rs 46,000 as #investor... | 0 | Gold prices slip below Rs 46000 as investors b... |
| 5788 | Workers at Bajaj Auto have agreed to a 10% wag... | 1 | Workers at Bajaj Auto have agreed to a 10 wage... |
| 5789 | #Sharemarket LIVE: Sensex off day’s high, up 6... | 1 | Sharemarket LIVE Sensex off day’s high up 600 ... |
| 5790 | #Sensex, #Nifty climb off day's highs, still u... | 1 | Sensex Nifty climb off days highs still up 2 K... |
5791 rows × 3 columns
stocks_df['Text'][2]
"user I'd be afraid to short AMZN - they are looking like a near-monopoly in eBooks and infrastructure-as-a-service"
stocks_df['Text Without Punctuation'][2]
'user Id be afraid to short AMZN they are looking like a nearmonopoly in eBooks and infrastructureasaservice'
PERFORM DATA CLEANING (REMOVE STOPWORDS)
# Obtain additional stopwords from nltk
from nltk.corpus import stopwords
stop_words = stopwords.words('english')
stop_words.extend(['from', 'subject', 're', 'edu', 'use','will','aap','co','day','user','stock','today','week','year', 'https','httpstco'])
# Remove stopwords and remove short words (less than 2 characters)
def preprocess(text):
  result = []
  for token in gensim.utils.simple_preprocess(text):
    if len(token) >= 2 and token not in stop_words:
      result.append(token)

  return result
# apply pre-processing to the text column
stocks_df['Text Without Punc & Stopwords'] = stocks_df['Text Without Punctuation'].apply(preprocess)
stocks_df['Text'][0]
'Kickers on my watchlist XIDE TIT SOQ PNK CPW BPZ AJ trade method 1 or method 2, see prev posts'
stocks_df['Text Without Punc & Stopwords'][0]
['kickers',
 'watchlist',
 'xide',
 'tit',
 'soq',
 'pnk',
 'cpw',
 'bpz',
 'aj',
 'trade',
 'method',
 'method',
 'see',
 'prev',
 'posts']
PLOT WORDCLOUD
stocks_df['Text Without Punc & Stopwords Joined'] = stocks_df['Text Without Punc & Stopwords'].apply(lambda x: " ".join(x))
plt.figure(figsize=(20,20))
wc = WordCloud(max_words= 1000, width = 1600, height= 800).generate(" ".join(stocks_df[stocks_df['Sentiment'] == 1]['Text Without Punc & Stopwords Joined']))
plt.imshow(wc, interpolation= 'bilinear');
# Negative
plt.figure(figsize=(20, 20))
wc = WordCloud(max_words= 1000, width= 1600, height= 800).generate(" ".join(stocks_df[stocks_df['Sentiment'] == 0]['Text Without Punc & Stopwords Joined']))
plt.imshow(wc, interpolation='bilinear')
<matplotlib.image.AxesImage at 0x7fa867cb4520>
VISUALIZE CLEANED DATASETS
# word_tokenize is used to break up a string into words
print(stocks_df['Text Without Punc & Stopwords Joined'][0])
print(nltk.word_tokenize(stocks_df['Text Without Punc & Stopwords Joined'][0]))
kickers watchlist xide tit soq pnk cpw bpz aj trade method method see prev posts
['kickers', 'watchlist', 'xide', 'tit', 'soq', 'pnk', 'cpw', 'bpz', 'aj', 'trade', 'method', 'method', 'see', 'prev', 'posts']
# Obtain the maximum length of data in the document
# This will be later used when word embeddings are generated
maxlen = -1
for doc in stocks_df['Text Without Punc & Stopwords Joined']:
  tokens = nltk.word_tokenize(doc)
  if (maxlen < len(tokens)):
    maxlen = len(tokens)
print("The maximum number of words in any doucment is:", maxlen)
The maximum number of words in any doucment is: 22
tweets_length = [len(nltk.word_tokenize(x)) for x in stocks_df['Text Without Punc & Stopwords Joined']]
# Plot the distribution for the number of words in a text
fig = px.histogram(x = tweets_length, nbins= 50)
#fig.show()
PREPARE THE DATA BY TOKENIZING AND PADDING
# Obtain the total words present in the dataset
list_of_words = []
for i in stocks_df['Text Without Punc & Stopwords']:
  for j in i:
    list_of_words.append(j)
# Obtain the total number of unique words
total_words = len(list(set(list_of_words)))
total_words
9646
# split the data into test and train
X = stocks_df['Text Without Punc & Stopwords']
y = stocks_df['Sentiment']

from sklearn.model_selection import train_test_split
X_train, X_test, y_train, y_test = train_test_split(X, y, test_size = 0.1)

print(f'Training Shape:',X_train.shape)
print(f'Testing Shape:',X_test.shape)
Training Shape: (5211,)
Testing Shape: (580,)
# Create a tokenizer to tokenize the words and create sequences of tokenized words
tokenizer = Tokenizer(num_words= total_words)
tokenizer.fit_on_texts(X_train)

train_sequences = tokenizer.texts_to_sequences(X_train)
test_sequences = tokenizer.texts_to_sequences(X_test)
print('The encoding for document \n', X_train[1:2], '\n', train_sequences[1])
The encoding for document
 1884    [story, moving, tandem]
Name: Text Without Punc & Stopwords, dtype: object
 [484, 134, 3847]
# Add padding to training and testing
padding_train = pad_sequences(train_sequences, maxlen= 15, padding= 'post', truncating='post')
padding_test = pad_sequences(test_sequences, maxlen= 15, truncating= 'post')
for i, doc in enumerate(padding_train[:3]):
  print("The padded encoding for documents:", i+1," is:", doc)
The padded encoding for documents: 1  is: [  20 3841 1400 3842 3843   21 3844 3845 3846    0    0    0    0    0
    0]
The padded encoding for documents: 2  is: [ 484  134 3847    0    0    0    0    0    0    0    0    0    0    0
    0]
The padded encoding for documents: 3  is: [ 290  116 2017 1196  545  303  202   99 2018  640  340 1646  920    0
    0]
# Convert the data to categorical 2D representation
y_train_cat = to_categorical(y_train, 2)
y_test_cat = to_categorical(y_test, 2)

# Printing to see accurate distribution
print(f'Training Shape:', y_train_cat.shape)
print(f'Testing Shape:', y_test_cat.shape)
Training Shape: (5211, 2)
Testing Shape: (580, 2)
DEEP LEARNING NEURAL NETWORK TO PERFORM SENTIMENT ANALYSIS
# Sequential Model
model = Sequential()

# embedding layer
model.add(Embedding(total_words, output_dim = 512))

# LSTM
model.add(LSTM(256))

# Dense layers
model.add(Dense(128, activation = 'relu'))
model.add(Dropout(0.3))
model.add(Dense(2,activation = 'softmax'))
model.compile(optimizer = 'adam', loss = 'categorical_crossentropy', metrics = ['acc'])
model.summary()
Model: "sequential"
_________________________________________________________________
Layer (type)                 Output Shape              Param #
=================================================================
embedding (Embedding)        (None, None, 512)         4938752
_________________________________________________________________
lstm (LSTM)                  (None, 256)               787456
_________________________________________________________________
dense (Dense)                (None, 128)               32896
_________________________________________________________________
dropout (Dropout)            (None, 128)               0
_________________________________________________________________
dense_1 (Dense)              (None, 2)                 258
=================================================================
Total params: 5,759,362
Trainable params: 5,759,362
Non-trainable params: 0
_________________________________________________________________
model.fit(padding_train, y_train_cat, batch_size= 32, validation_split= 0.2, epochs= 2)
Epoch 1/2
131/131 [==============================] - 20s 139ms/step - loss: 0.6334 - acc: 0.6636 - val_loss: 0.4766 - val_acc: 0.7526
Epoch 2/2
131/131 [==============================] - 20s 152ms/step - loss: 0.2858 - acc: 0.8921 - val_loss: 0.5192 - val_acc: 0.7824


<tensorflow.python.keras.callbacks.History at 0x7fa869ca22b0>
ASSESS TRAINED MODEL PERFORMANCE
# make prediction
pred = model.predict(padding_test)
# make prediction
prediction = []
for i in pred:
  prediction.append(np.argmax(i))
# list containing original values
original = []
for i in y_test_cat:
  original.append(np.argmax(i))
# acuracy score on text data
from sklearn.metrics import accuracy_score

accuracy = accuracy_score(original, prediction)
accuracy
0.7793103448275862
# Plot the confusion matrix
print('''"0" = Negative & "1" = Positive''')
cm = confusion_matrix(original, prediction)
sns.heatmap(cm, annot = True);
"0" = Negative & "1" = Positive
Andrew D'Armond
Leveraging data science to achieve results